
AI-narrated version of this post using a synthetic voice. Great for accessibility or listening while busy.
A home lab that draws 150 watts continuously costs more per year in electricity than most people running one have ever actually calculated – and the number tends to surprise people once they do the math, in both directions. Sometimes it’s lower than the anxiety suggested; sometimes a GPU box running local AI models around the clock is quietly adding $30-50 a month nobody budgeted for. Either way, wattage as an abstract spec-sheet number and wattage as an actual dollar cost are two different things, and this site has covered plenty of hardware specs without ever walking through the second half of that equation directly.
Our CPU wattage and idle power guide covers which processors sip power at idle, and our UPS and battery backup guide covers protecting the hardware from power events – this post sits between those two, translating the watts either one discusses into an actual monthly number on your electricity bill.
Free tool: add up what your gear costs to run each month and how long your UPS will keep it online. Home lab power & UPS runtime calculator →
Who Should Actually Care About This Math
If your home lab is a single NAS and a Raspberry Pi, the honest answer is that the electricity cost is small enough not to lose sleep over – probably somewhere in the $3-8 a month range depending on your rate and the specific hardware, and not worth obsessing over. This math matters more as the lab grows: multiple always-on servers, a GPU running local AI inference for hours a day, a rack full of drives spinning continuously. At that scale, the difference between a well-chosen low-idle-power setup and a power-hungry one can genuinely run $20-60 a month, which adds up to a real annual number worth knowing before it shows up as a surprise on a summer electricity bill.
Step One: Measuring What You Actually Draw
Manufacturer spec sheets list a maximum rated power draw that almost nothing hits in real-world idle or typical-load conditions – it’s a worst-case number for the power supply’s rating, not a prediction of your electricity bill. The only way to know actual draw is measuring it, and a simple plug-in meter like a Kill A Watt EZ does this directly: plug the device into the meter, plug the meter into the wall, and read real-time watts along with cumulative kWh over whatever period you leave it connected. Measure each device separately for at least 24-48 hours to capture both idle and typical-use patterns rather than a single point-in-time reading, since a NAS idling overnight and running a backup job during the day can show meaningfully different average draw than either extreme alone suggests.
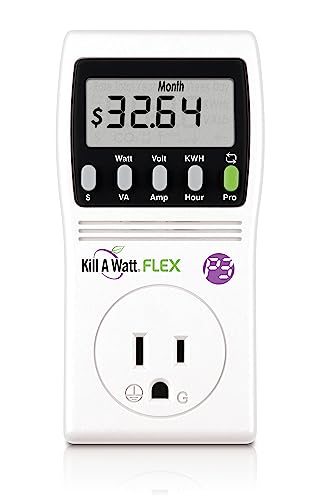
- The P4456 Kill A Watt Flex is the next-generation upgrade to the classic P4400, offering enhanced tracking, stored data, and de…
- Unlike basic watt meters, the P4456 stores your power usage data, so you don’t lose readings when moving between outlets or app…
- See not just how much electricity you use, but your estimated environmental impact — a feature not available on standard watt m…
For an always-on rack with several devices, a smart plug with built-in energy monitoring on each device gives you the same data continuously and remotely, rather than requiring you to physically check a meter – useful for tracking draw over weeks or months and catching a device whose power draw creeps up over time, a common early warning sign of a failing PSU or a fan running harder than it should.

- 【Matter-Certified】Matter-certified devices, regardless of brand, can work together and are compatible with most major smart hom…
- 【Insightful Energy Tracking】 Monitor your energy consumption with in-depth statistics and clear visuals, helping you optimize p…
- 【Estimate Your Energy Bill】 Enhance energy management by integrating with billing systems for clear cost visualization (both si…
Step Two: Converting Watts to a Real Dollar Number
The formula is straightforward once you have a real watts number: multiply watts by 24 hours, divide by 1,000 to get daily kWh, then multiply by your electricity rate per kWh and by 30 for a monthly figure. A device drawing a steady 50 watts works out to 1.2 kWh a day, or 36 kWh a month – at a rate around $0.16/kWh that’s roughly $5.75 a month, but rates vary enormously by region, from under $0.10/kWh in some areas to over $0.30/kWh in others, which is exactly why a generic “home lab costs $X” answer online is close to useless without plugging in your own actual rate. Check your utility bill for your actual per-kWh rate, including any time-of-use pricing that charges more during peak hours – a server running heaviest during evening peak hours on a time-of-use plan costs more than the same draw spread evenly across a day.
Per-Device Breakdown: Where the Money Actually Goes
Spinning hard drives are a bigger factor than people expect – a NAS with eight drives can draw 60-100 watts just keeping drives spinning at idle, before any actual file transfer activity, and that’s before accounting for a rebuild or scrub operation pulling meaningfully more. A modest mini PC running Proxmox with a handful of lightweight VMs typically idles in the 10-25 watt range on efficient modern hardware, which is part of why the mini-PC-as-home-server trend has real economic logic behind it, not just space savings. A Raspberry Pi sips 3-7 watts continuously, cheap enough that its electricity cost is genuinely a rounding error next to almost anything else in a rack. A GPU running local AI inference is the outlier that changes the whole calculation – a consumer GPU under sustained load can pull 200-350 watts, and running that for several hours a day adds up to a real monthly cost that dwarfs everything else in a typical home lab combined.
Comparison: Typical Monthly Cost by Device Class
| Device Class | Typical Draw | Monthly kWh | Approx. Monthly Cost (at $0.16/kWh) |
|---|---|---|---|
| Raspberry Pi (idle, always-on) | 3-7W | 2.2-5 kWh | $0.35-0.80 |
| Mini PC running Proxmox (light VM load) | 10-25W | 7.2-18 kWh | $1.15-2.90 |
| 4-8 bay NAS (idle, drives spinning) | 30-60W | 21.6-43 kWh | $3.45-6.90 |
| 12-bay+ rackmount NAS (idle) | 60-100W | 43-72 kWh | $6.90-11.50 |
| Consumer GPU box (4hrs/day AI inference load) | avg ~120W blended | 86 kWh | about $14 |
| Full rack (NAS + switch + mini PC + UPS overhead) | 150-250W blended | 108-180 kWh | $17.30-28.80 |
When a UPS or Solar Setup Actually Pays for Itself
A UPS is primarily a protection device, not a cost-saving one – it doesn’t reduce your electricity draw, and in fact adds a small amount of its own overhead running its internal electronics and keeping its battery topped up. The financial case for a UPS is avoiding the cost of a bad shutdown (a NAS array left mid-write during a power blip is a real data-corruption risk) rather than reducing a monthly bill, so don’t expect it to show up as savings in this calculation. Solar is a different conversation entirely and the payback math depends heavily on local incentives, panel and installation costs, and your actual usage pattern – for most home lab operators, a small lab’s power draw alone rarely justifies a dedicated solar investment on its own, but it becomes a meaningfully bigger piece of the payback calculation if you’re already considering solar for the whole house and want to factor the lab’s baseline draw into system sizing.
Reducing the Bill Without Reducing Capability
The cheapest watts are the ones you never draw in the first place, and the biggest lever most people have is consolidation – running three lightly-loaded devices instead of one that could handle all three workloads means paying the idle-power cost three times over. Migrating from an older, power-hungry NAS or server to modern efficient hardware often pays back its own electricity savings over a few years even before counting the performance upgrade as a separate benefit. Scheduling non-urgent, power-hungry tasks (a full array scrub, a large backup job, batch AI inference) during off-peak hours on a time-of-use electricity plan is a free optimization that costs nothing but a cron schedule change.
Standby and Phantom Draw From “Off” Devices
A surprising amount of a home lab’s total electricity cost comes from devices that appear to be off but aren’t – a network switch’s wall-wart power adapter, a UPS trickle-charging its battery, or a mini PC sitting in a low-power sleep state rather than a true shutdown all draw a small continuous trickle that adds up across a rack full of accessories. Individually these draws are tiny, often under 2-3 watts each, but a rack with a dozen such devices can add several dollars a month in draw that never shows up in anyone’s mental model of what the lab actually costs, because none of it is doing visible work. A Kill A Watt or energy-monitoring smart plug catches this just as well as it catches active-load draw, and it’s worth spot-checking a few “idle” accessories specifically, since this is the category of cost most home lab operators have never actually measured.
Seasonal Variation Most People Don’t Account For
Electricity cost calculations done once and never revisited miss a real seasonal factor: cooling load on the room housing the lab changes with the seasons even if the equipment’s own draw stays constant. A rack in an unconditioned space runs warmer in summer, which can push case and NAS fans to spin faster and draw modestly more power, while an air-conditioned room housing the rack adds its own cooling electricity cost that’s easy to mentally separate from the lab’s cost even though the lab is a real contributor to that cooling load. If a rack lives in a room with dedicated air conditioning, it’s worth acknowledging that the true cost of running it includes a share of that cooling cost, even though it won’t show up on a plug-in meter measuring the rack’s own devices directly.
The Practical Recommendation
Buy a Kill A Watt EZ before buying anything else in this space – fifteen dollars and a weekend of measuring your actual devices tells you more than any spec sheet or online calculator ever will, and it turns “I think my home lab probably costs something” into an actual number you can act on. If your setup already has several always-on devices, add smart plugs with energy monitoring on the highest-draw ones so you can track changes over time and catch a failing component before it becomes a bigger problem. And if a GPU box for local AI is part of your setup or on your wish list, run the math on realistic daily usage hours before buying – it’s consistently the single item most likely to turn a cheap hobby into a genuine monthly line item worth planning around.
Affiliate disclosure: As an Amazon Associate, HomeNode earns from qualifying purchases at no additional cost to you. Product availability subject to change.